【波動論2】
フーリエ級数展開2:f=x^2
物理現象を理解するうえで、非常に有効な道具にフーリエ級数展開があります。 フーリエ級数展開の有用性を理解するための準備として、解析的に求めた級数を用いて、元の関数を表現します。
元の関数
区間[-π,π]で周期的な関数と定義します。

フーリエ級数展開

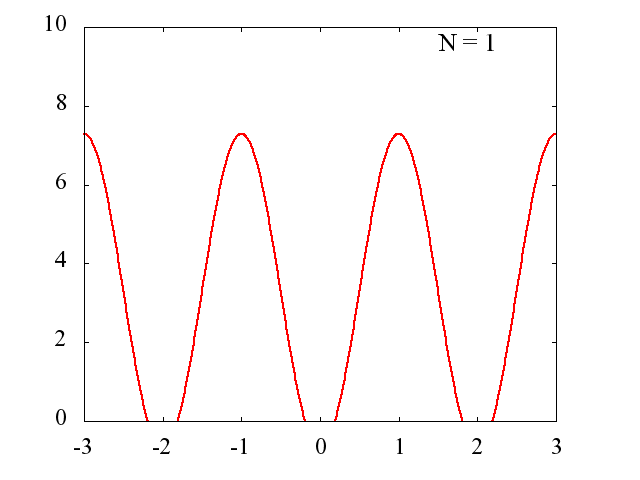
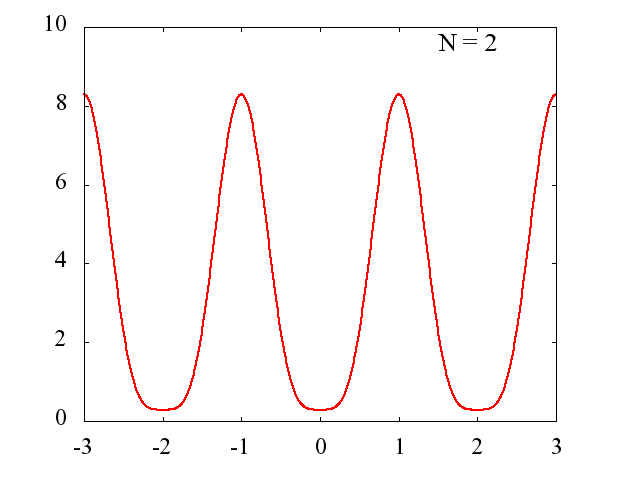
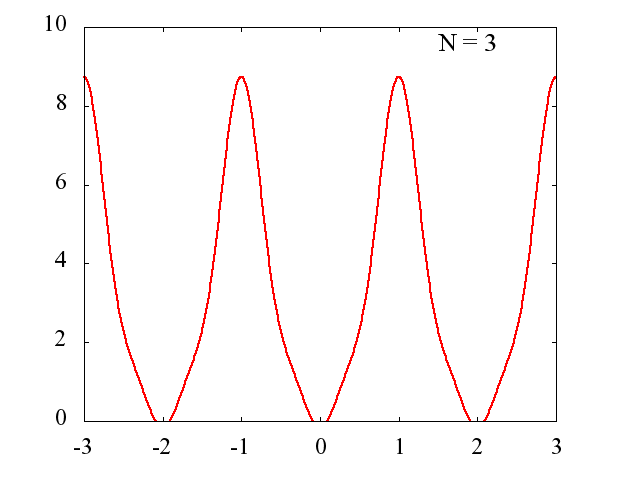
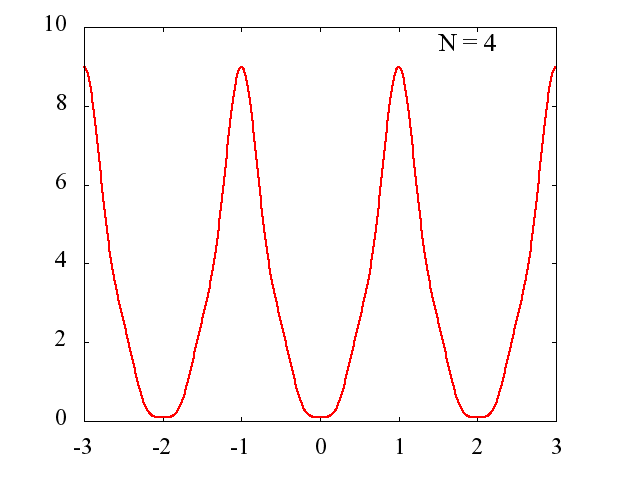
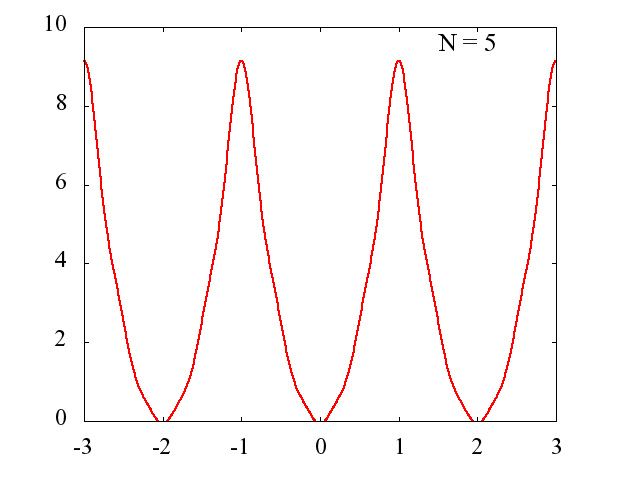
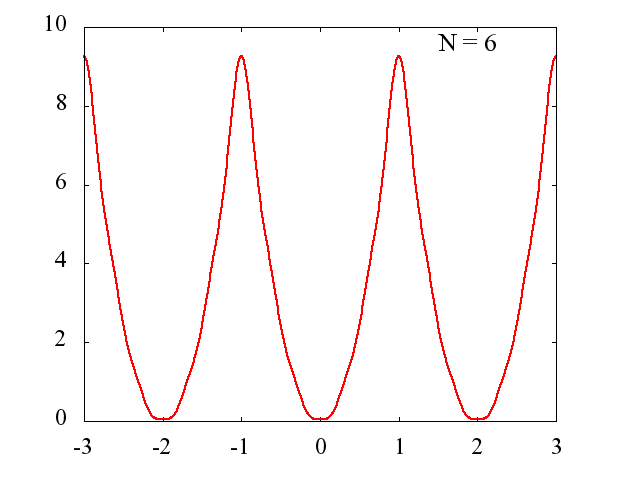
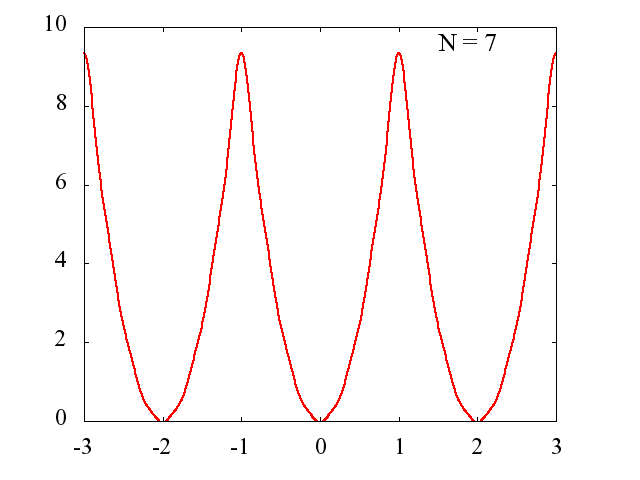
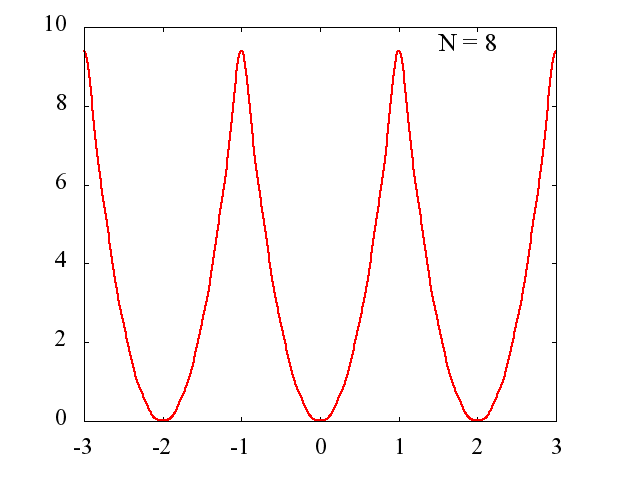
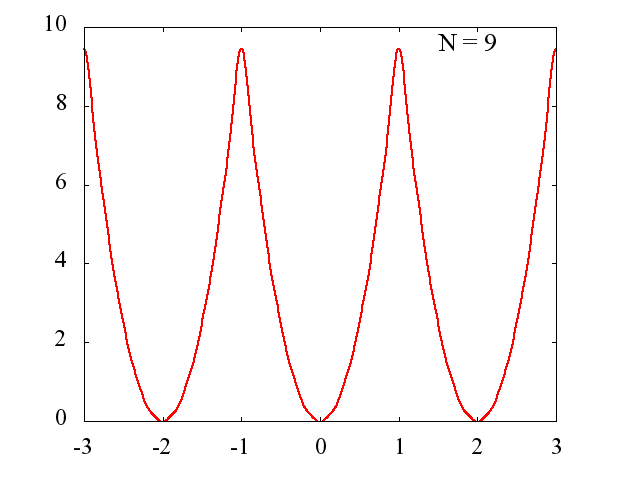
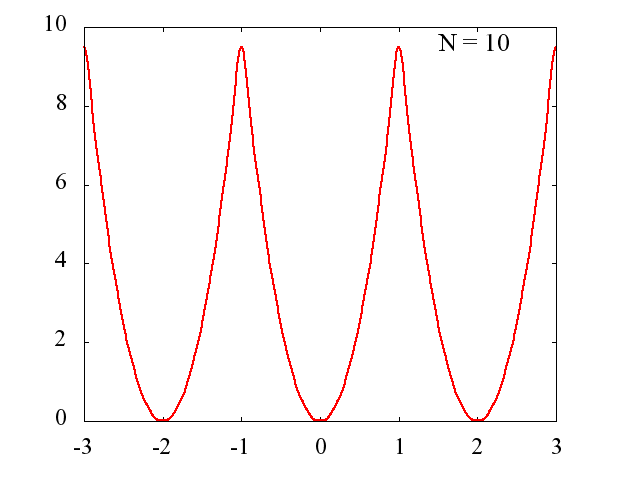
Nの値を多くするに従って、元の関数にどの様に近づいていくのかを見てみます。
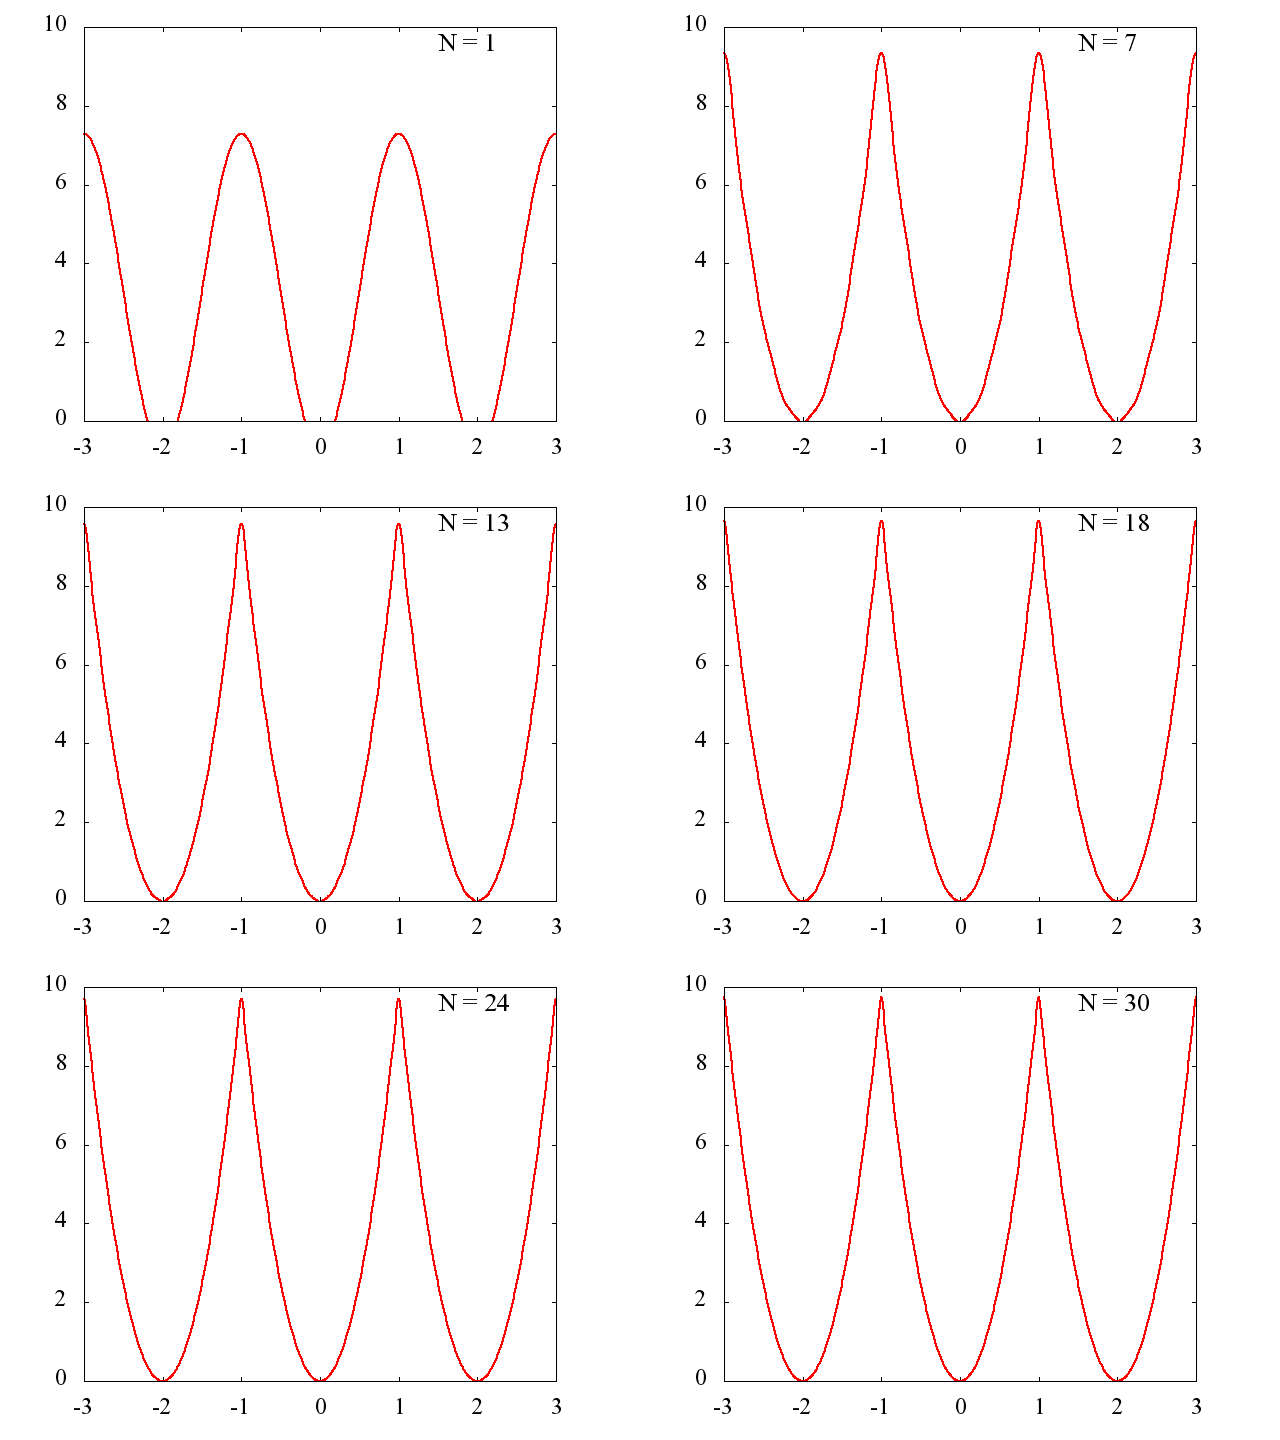
横軸:x/π
縦軸:f(x)
C++ソース
Nごとに区間[-3π,3π]を描画します。
/*
フーリエ級数
f(x)=x^2 [-PI,PI]
*/
#include <math.h>
#include <stdlib.h>
#include <time.h>
#include <fstream>
#include <sstream>
#include <iostream>
#include <string>
#include <cstdio>
#include <iomanip>
#include <stdio.h>
#include <complex>
#include <direct.h>
using namespace std;

double PI = acos(-1.0);
double e = 2.7182818284590452354;
complex<double> I = complex<double>(0.0,1.0);
int xN =1000;
int N = 10;
int T = 3;
string folder = "1", ff="", fg="";  //保存フォルダ名
ostringstream fname;
double phi(double x, int n);

int main(){
 _mkdir(folder.c_str());
	ff = folder + "/bn.data";    ofstream fout_bn( ff.c_str());
	ff = folder + "/fn.data";    ofstream fout_fn( ff.c_str());
	ff = folder + "/f.data";     ofstream fout_f( ff.c_str());
  for(int j=0; j<=xN; j++){
    double F=0.0;
    double x = (- PI + 2.0 * PI * double(j)/double(xN))*T;
    fout_bn << x/PI << " ";
    for(int i=1; i<=10; i++){
      fout_bn << phi(x, i) << " "  ;
    }
    fout_bn  << endl;
  }

  for(int j=0; j<=xN; j++){
    double x = (- PI + 2.0 * PI * double(j)/double(xN))*T;
    fout_fn << x/PI << " " ;
    for( N=2; N<=1024; N*=2){
      double F=0.0;
      for(int i=1; i<=N; i++){
        F += phi(x, i);
      }
      F += 1.0/3.0 * pow(PI,2);
      fout_fn << F << " ";
    }
    fout_fn << endl;
  }
  return 0;
}
double phi(double x, int n){
  return  4.0 * pow(-1.0,n)  /pow(double(n),2) * cos(double(n)*x);
}
gnuplot テンプレート
データからjpgファイルを出力します
////////////////////////////////////////////////
// gnuplot テンプレート
////////////////////////////////////////////////
set terminal jpeg  enhanced font "Times" 20 size size 600, 480
set tics font 'Times,18'
set rmargin 3
set lmargin 6
set nokey
set yr[-4:4]

if (exist("n")==0 || n<0) n=1 #変数の初期化

file0(n) = sprintf("3/%d.data",n) #入力ファイル名
outfile(n) = sprintf("3-/%d.jpg",n+10000)  #出力ファイル名
title(n) = sprintf("N = %d",n)  #タイトル名

unset label
set label title(n)  font 'Times,20'  at 1.5 , 3.5

set output outfile(n)
plot file0(n) u 1:2 w l lw 2

if (n<30)  n=n+1; reread
